Contents
 Welcome
    Features
    ACT! Dashboard
 Installation
    System Requirements
    Obtaining Installation Program
    Running Installation
    Activation
    Obtaining Updates
    Launching Keystroke Dash
 Dashboard Elements
    Dashboard Tabs
    Dashboard Toolbar
       New
       New *Wizard*
       Open
       Save
       Print
       Preferences
       Refresh
       Help
       About
    Panel Toolbar
       Panel Title
       Filter Icon
       Display Type Icon
          List View
          KPI View
          Graph View
       User Icon *Legacy ONLY*
       Contact Group Icon *Legacy ONLY*
       Export to Excel Icon
       Grouping Icon
       List Sorting
       List Filtering
       List Summaries
       Date Range and Record Count *Legacy ONLY*
       Change Dashboard Title
    Rows and Columns
    Deleting Panels
 Dashboard Panels
    Companies
    Company Query
    Contact Query
    Group Query
    History Query
    Manual SQL Query
    Note Query
    Opportunity Query
    Product Query
    Solution Query 
    Synchronization
    Users
    Other - Contact Details
    Other - Database Update
    Legacy Dashboards
       Activities
       Contacts by Group
       Histories
       Notes
       Opportunities
       Products
 Advanced Functions
    Dash Advanced Query Designer
       Previewing Queries
       Saving Queries
       Opening Saved Queries
       Advanced Query Info
       Adding Criteria
       Deleting Criteria
       Moving Criteria
       Grouping Criteria
    Renaming Dashboards
    Protecting Dashboards
    Deleting Dasboards
    Organizing Dashboard Folders
    Title Bar Colors
    Custom Relative Dates
    Copying Panels
    Moving Panels
    Printing to Excel
    Printing to PDF
    Adding Logos to Output
    Rescheduling Activities
    Update Fields
 Tutorials
    Simple Dashboard
    Creating a Graph
    Creating A KPI
    Advanced Query (Only Wizard)
 Relationship Reports
 Dashboard Editions
 Dashboard Version Compatibility
 Configuring Keystroke Alerts with Dashboard
 FAQ
    General FAQ


Display Keyword IndexAdd to your browser favoritesPrint PageGet the URL to link to this page
Search: Search for pages containing this text

Home > Dashboard Elements > Panel Toolbar > Display Type Icon > Graph View

Graph View

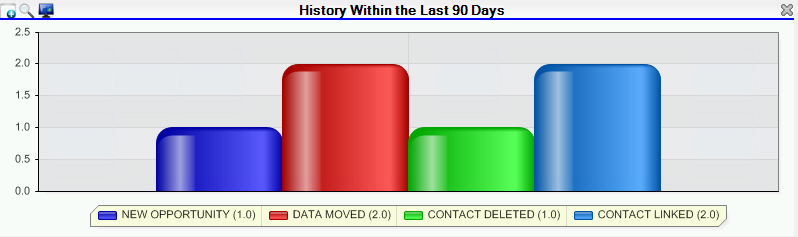
The Graph view displays data in graphical format over the selected date range.


Graph Styles

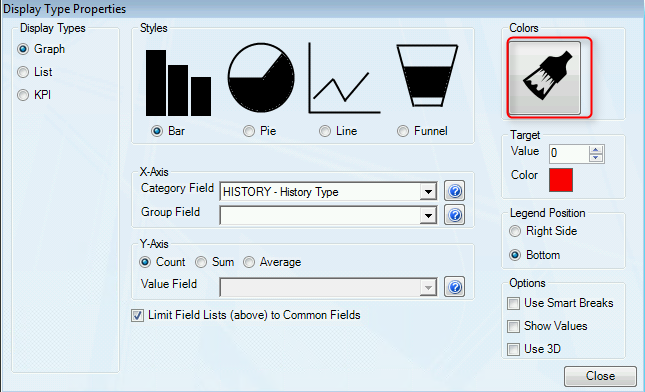
There are 4 graph styles to choose from:

  • Bar Graph
  • Pie Graph
  • Line Graph
  • Funnel Graph

X-Axis

Determine the data to be displayed on the X-Axis (and Legend Box) with the Category Field.  All fields in related objects are available. (See Dashboard Panels for list of fields.) Graph more than one item with the Group Field.

Y-Axis

Determine the data to be displayed on the Y-Axis.  By default, it is a count of records, but it can be changed to a Sum or Average of any.

Legend Position

The Legend can be placed at the bottom or right side of the graph.

Target

A target line can be placed on the graph (for Bar and Line graphs) for any value and can be assigned any color.

Options

  • Smart Breaks can assist in displaying a graph where the range of data is wide.
  • Show Values will display numeric values on the graph.
  • Use 3D will attempt to render the graph in 3D.
  • Show Common Fields will restrict the fields of related objects to those determined to be common by Keystroke.
  • Choosing Color of your graph 

See also

  
HelpConsole 2008 - Enterprise Edition

Copyright © 2004 - 2008 Extreme Ease Software Inc. All Rights Reserved.