 Reporting on Usage Statistics
Reporting4Act! maintains usage statistics for reports, including who ran a report when and with what database. The Usage Reporting function in the Tools menu allows you to report on these statistics. This allows you to determine which reports are actually being used, how often, and by whom.
You must have an Ultimate license to report on usage statistics.
When you select Usage Reporting from the Tools menu, another instance of Reporting4Act! runs, displaying "Usage Reporting" in the title bar. Like the normal Reporting4Act!, you can create reports, preview or print them, output them to file, and so on. However, this version of Reporting4Act! only reports on the usage statistics, not on your database. When you create a report, you only see one table—Usage—, with the following fields:
Report Name: the name of the report.
Report Type: the type of report: Quick, Cross-tab, Label, Chart, Gauge, or Dashboard.
Folder: the folder the report is in.
Database: the database the user ran the report against.
Run By: the name of the user who ran the report.
Run At: the date and time the report was run.
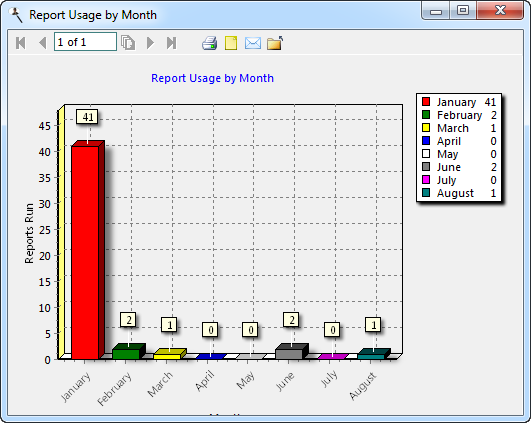
You can create any type of report you wish. For example, here's a chart showing how many times reports were run by month:
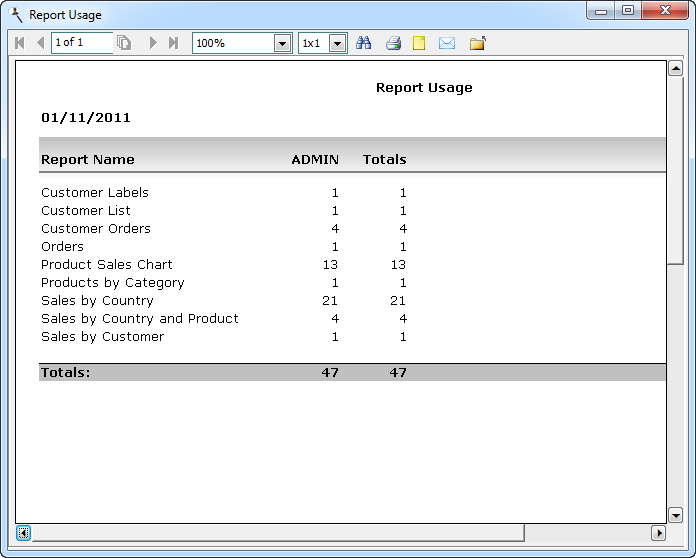
This cross-tab report shows how many times each user ran each report:
If you want to turn off usage tracking, add the following to the [Options] section of Data.INI in the Data subdirectory of the program folder:
Usage=N