 Creating a Report
You can create reports as long as you have a license other than Basic or Report Viewer.
If you are connected to an Act! 2010-2013 database, then when you create a new report, you will see this informational screen:
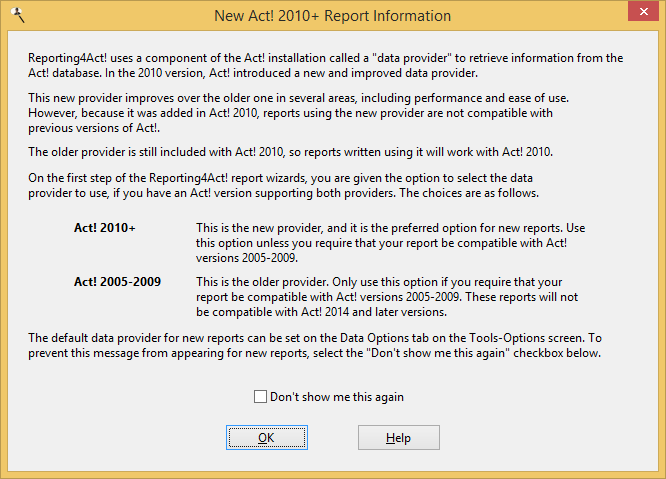
If you do not want this screen to appear for new reports, turn on the Don't show me this again checkbox. You can also control this using the option on the Data Options tab of Query's Options screen. For more information about Act! data providers, see the Understanding Act! Data Providers topic.
To create a new report, do one of the following:
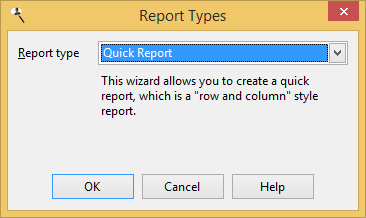
Click the New button in the Reports Explorer toolbar and choose the desired report type from the Reports Types dialog.
Choose New Report from the File menu; this also displays the Reports Types dialog.
Right-click anywhere in the Reports Explorer and choose New Report from the shortcut menu to display the Reports Types dialog.
Press the Insert key; this also displays the Reports Types dialog.
Click the down arrow to the right of the New button in the toolbar and choose the desired report type from the menu that appears.
Seven types of reports are available:
Quick report: a "row and column" style report. This is the most common type of report in Reporting4Act!.
Cross-tabulation report: a cross-tabulation (or "cross-tab") report, which is similar to a PivotTable in Microsoft Excel and is used for data analysis.
Label report: use for mailing or other types of labels.
Chart report: creates charts from your data, including bar and pie charts.
Gauge report: creates gauges from your data.
Dashboard: displays one or more charts in a separate window and automatically refreshes them at an interval you decide.
Batch report: runs two or more reports, one after the other.
External report: a report created in another application added to the Reports Explorer so you can easily run it.